How to Create a Gantt Chart Online
A practical, step-by-step guide to building a professional Gantt diagram in GanttTool — from loading the demo project through configuring settings, adding tasks with dependencies, to generating and exporting your finished chart.
GanttTool is a free, browser-based Gantt chart maker that turns a visual editor into a PlantUML diagram — no signup, no installation. This guide walks you through every step of the real workflow, matching the buttons and fields you will actually see in the app.
Before you start: New to Gantt charts? Read What Is a Gantt Chart? first to understand phases, milestones, and dependencies — the concepts you will configure in the steps below.
Open GanttTool
Navigate to gantttool.com/en/app in any modern browser. The app loads instantly — no account, no installation, no waiting. You land directly in the editor with a single blank task ready to fill in.
Your work is auto-saved to browser LocalStorage continuously, so refreshing the page or closing the tab will not lose your project. The data stays in your browser until you clear it manually or import a different project.
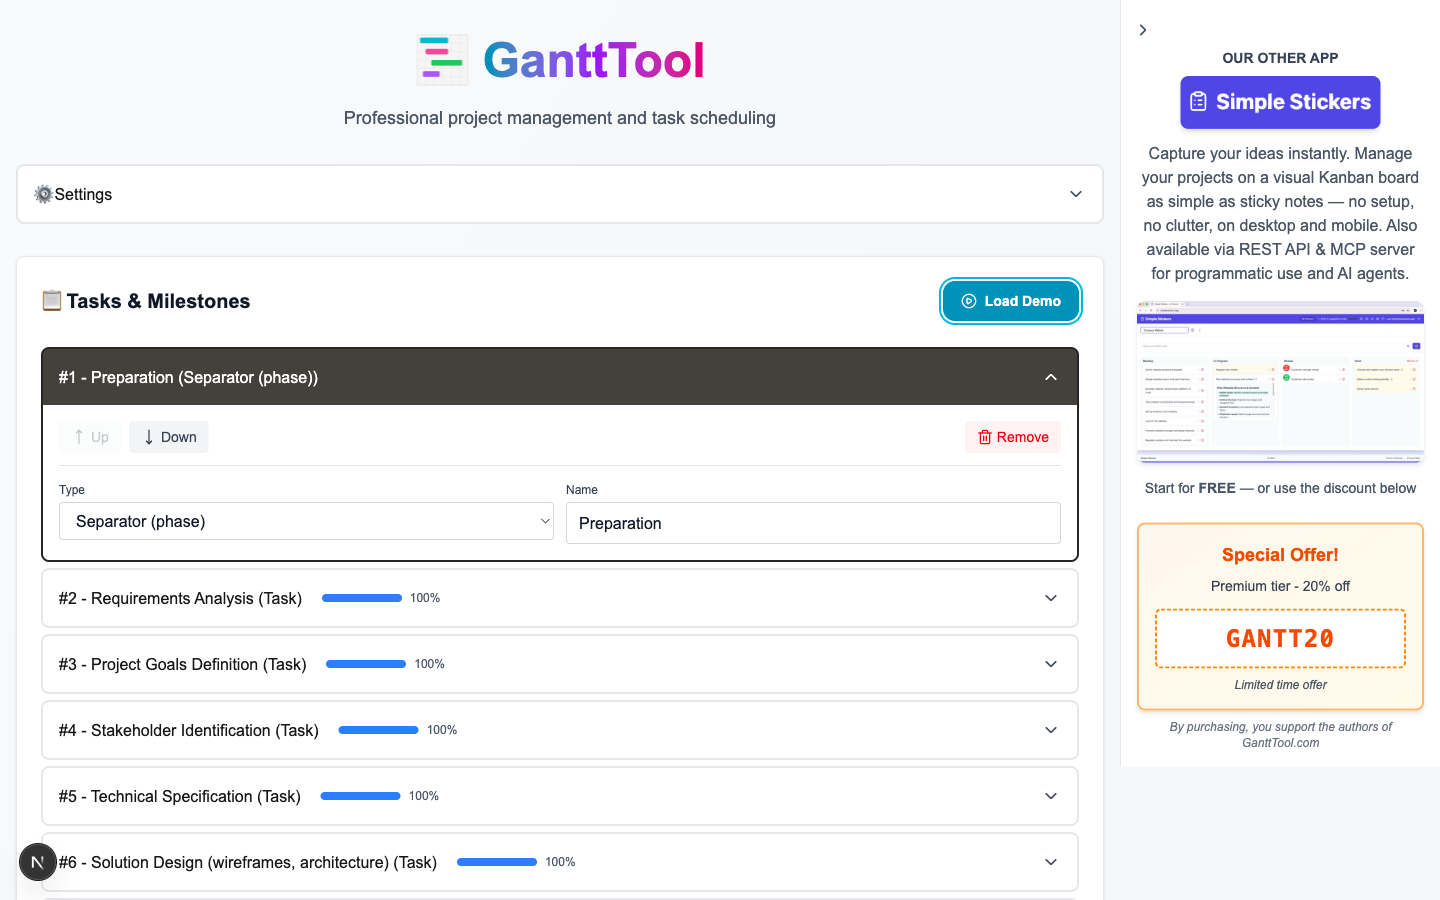
Load the Demo Project (optional but recommended)
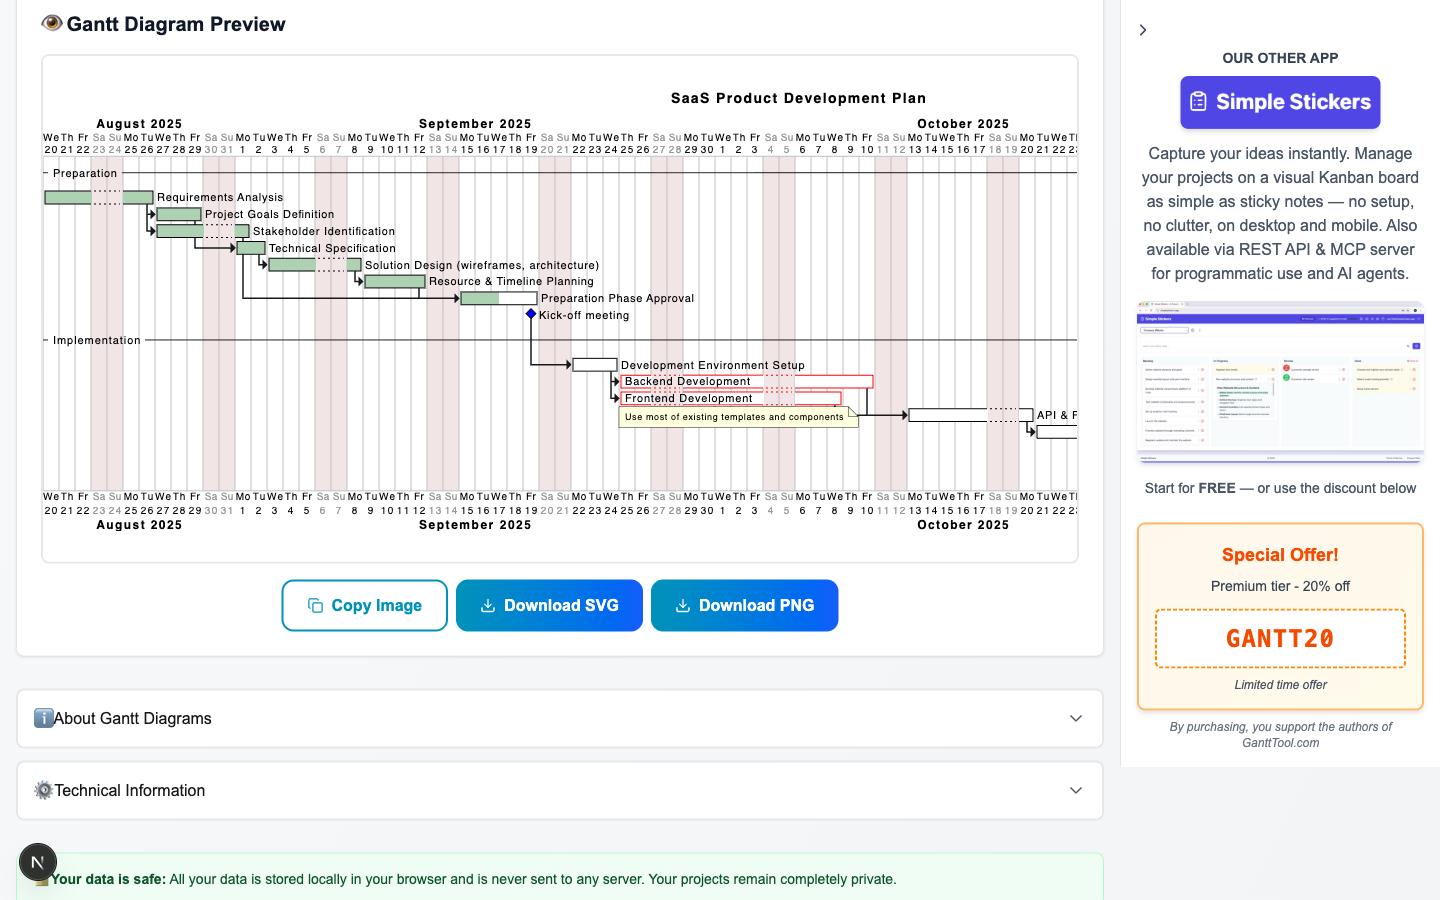
Click the "Load Demo" button in the toolbar. In one click, the editor is populated with a realistic SaaS Product Development Plan containing:
- 2 phase separators — "Preparation" and "Implementation"
- 15 regular tasks — from Requirements Analysis through Production Deployment
- 1 milestone — "Kick-off meeting" placed at the end of the preparation phase
- Chained dependencies — tasks link via "at task end" relationships forming a realistic critical path
- Completion tracking — preparation tasks are marked 50–100% complete
- Project start date set to 2025-08-20, daily scale, weekends closed
The demo is the fastest way to understand every feature before editing your own project. You can freely modify any task in the demo — or click "Reset" to return to a blank slate at any time.
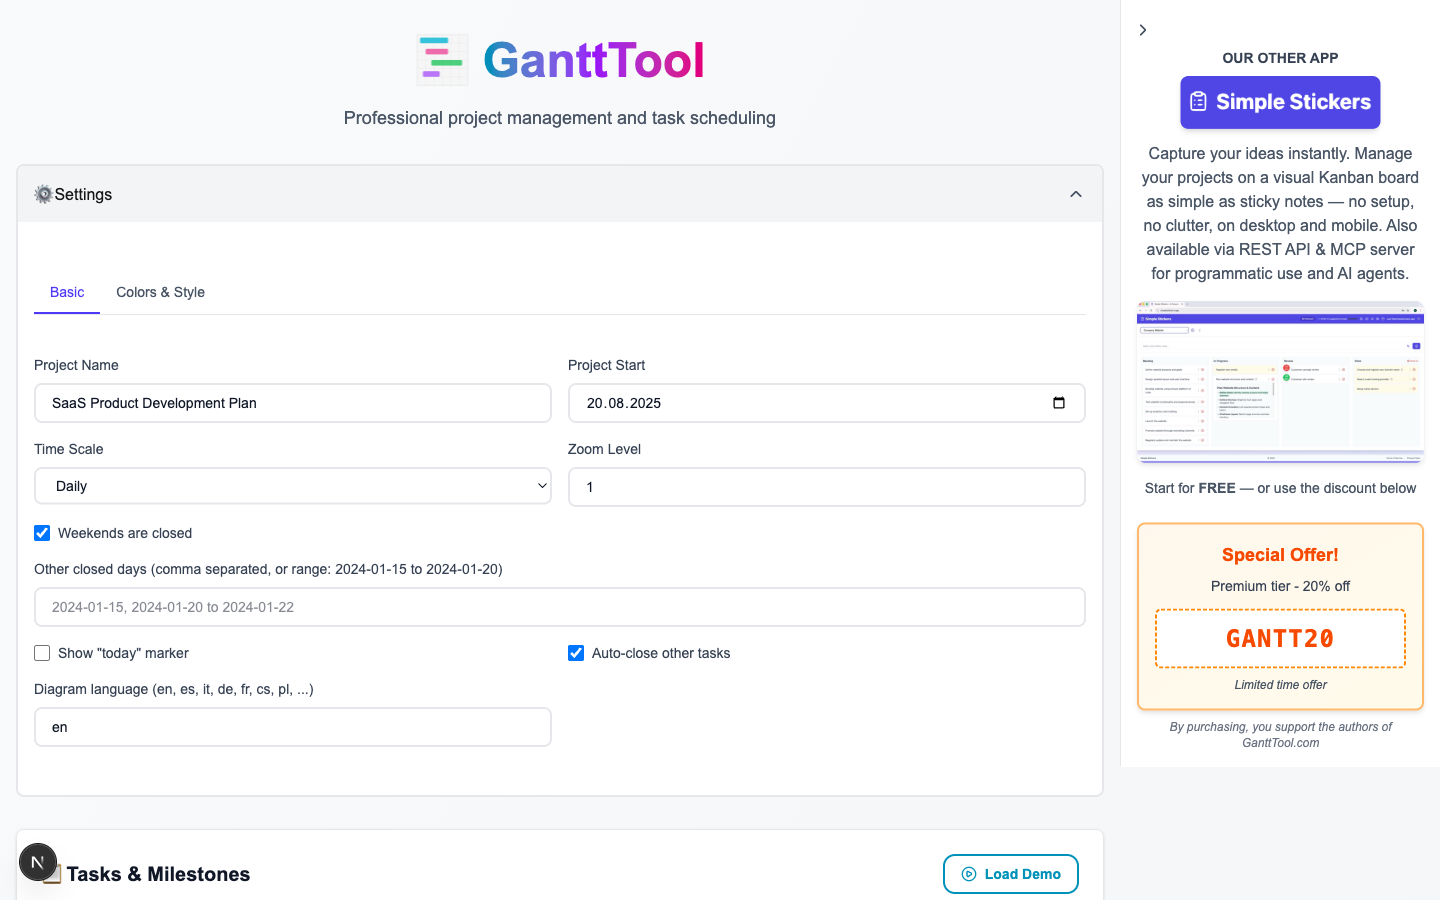
Configure Project Settings
Click the "Settings" accordion (the gear-icon panel at the top of the sidebar). It has two tabs: Basic and Colors & Style.
Basic tab
| Field | What it does |
|---|---|
| Project Name | The title printed at the top of the generated diagram. |
| Project Start | The anchor date (YYYY-MM-DD) from which all "Project Start" tasks are calculated. |
| Time Scale | Daily for short sprints, Weekly for medium projects, Monthly for long roadmaps. |
| Zoom Level | A multiplier (1–4) that widens each column, useful when many tasks overlap. |
| Weekends Closed | Marks Saturdays and Sundays as non-working days on the chart. |
| Other Closed Days | Comma-separated dates or date ranges (e.g. 2025-12-25, 2025-12-26 to 2025-12-31) excluded from the schedule. |
| Show Today Marker | Draws an orange vertical line at today's date so you can compare planned vs. actual progress instantly. |
| Diagram Language | A two-letter locale code (e.g. en, cs, de, fr) that localises month and day labels inside the diagram. |
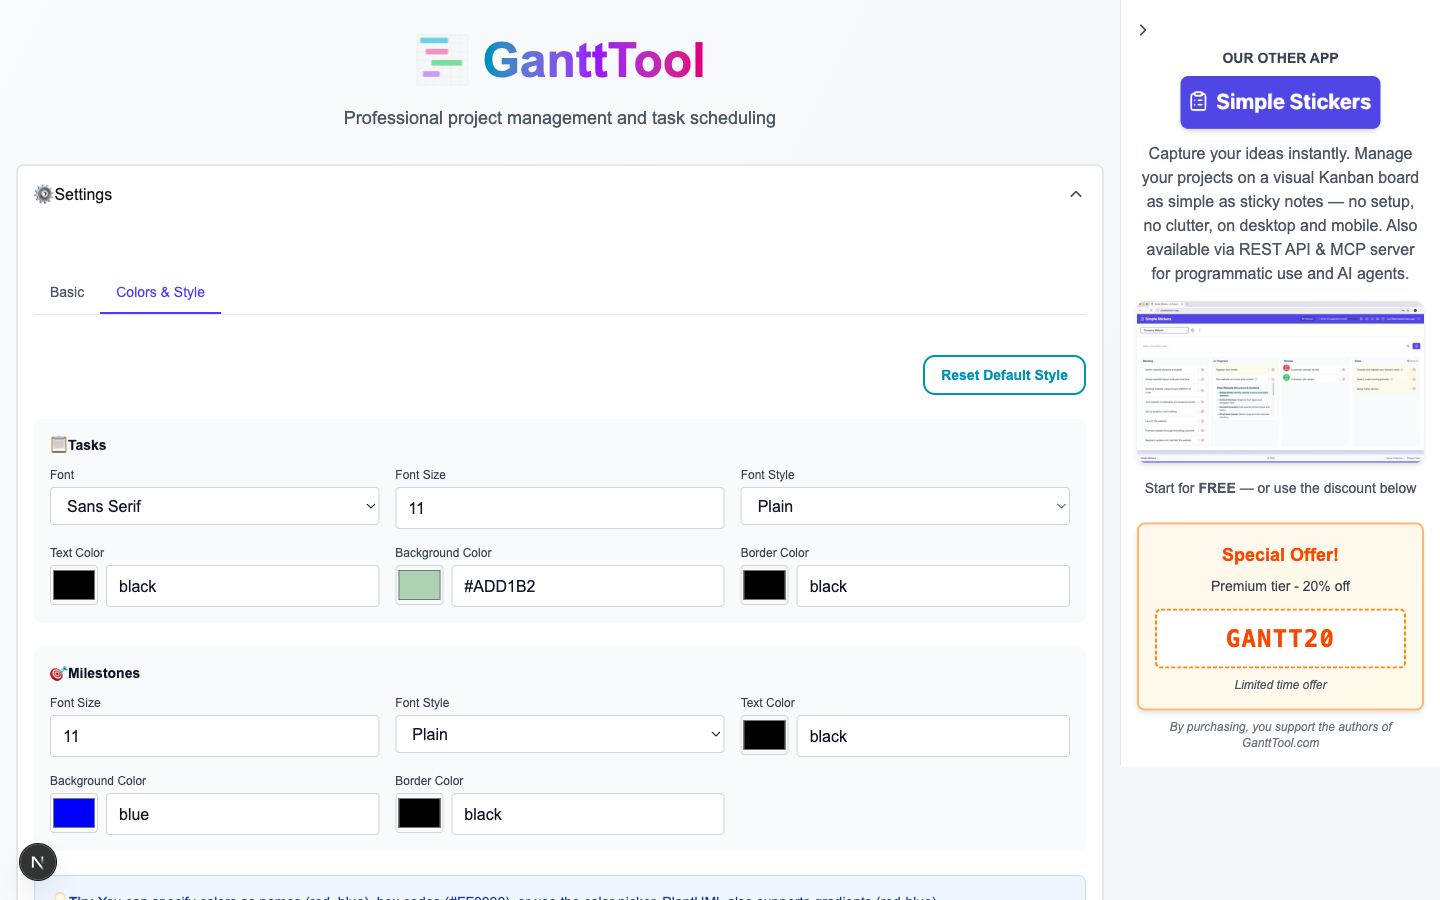
Colors & Style tab
Switch to the Colors & Style tab to control the visual look of every task bar and milestone marker in the diagram:
- Task font: name (SansSerif, Monospaced, Arial, etc.), size, color, and style (plain / bold / italic)
- Task bar color: the default background fill for all task bars (individual tasks can override this)
- Task line color: the border color of task bars
- Milestone font: independent font size, color, and style for milestone labels
- Milestone color: fill and border color of the milestone diamond marker
A Reset to defaults button restores the original color scheme without touching your tasks.
Add and Edit Tasks
The task list is the heart of the editor. Every row represents one item on the Gantt chart. Three ways to add a new row:
- Click the "Add Task" button below the task list to append at the end.
- Press Ctrl+Enter anywhere in the app for the same result.
- Hover between two existing tasks and click the insert zone (a thin blue line with a "+" icon) to insert at a specific position.
Each task opens in an accordion panel. Drag the handle on the left edge to reorder tasks, or use the up/down arrow buttons inside the panel.
Task type
| Type | Appearance in diagram | When to use |
|---|---|---|
| Task | Horizontal bar with duration | Any work item with a start and end |
| Milestone | Diamond marker (zero duration) | Key checkpoints, approvals, releases |
| Separator | Full-width section banner | Phase headers (e.g. "Design", "Development") |
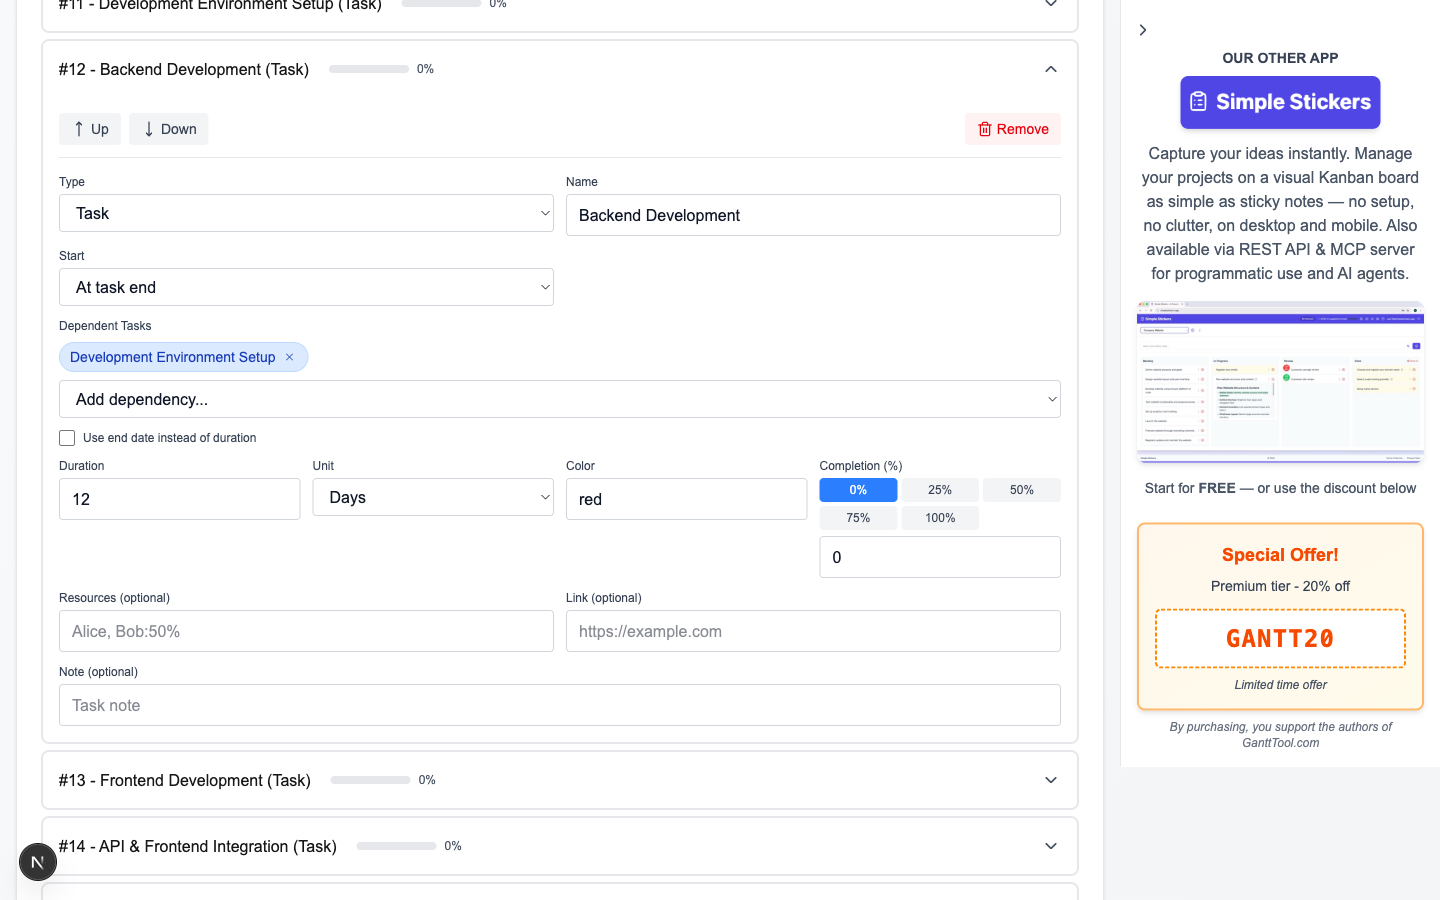
Start type — when does this item begin?
Each task has a Start Type selector that determines how its position on the timeline is calculated:
| Start type | Meaning |
|---|---|
| Project Start | The task begins on the global project start date set in Settings. |
| Absolute Date | A specific calendar date (YYYY-MM-DD) you enter manually, independent of other tasks. |
| After Task End | Starts after the selected task(s) finish, with an optional offset in days (positive = gap, negative = overlap). |
| Before Task Start | Starts a specified number of days before another task begins. |
| At Task Start | Begins exactly when the selected task starts (parallel tasks). |
| At Task End | Begins exactly when the selected task ends (classic finish-to-start dependency with zero lag). |
Multiple dependencies: When using "After Task End", "At Task Start", or "At Task End", you can select multiple predecessor tasks using checkboxes. The dependent task will start after all selected predecessors satisfy the condition. GanttTool automatically detects cyclic dependencies and blocks diagram generation if a cycle is found.
Duration and end date
By default, a task uses Duration (number of days or weeks). Toggle "Use end date" to pin the task to a specific end date instead — useful when a deadline is fixed by an external commitment.
Additional task fields
- Color — A per-task color override (hex or named color) that replaces the global task bar color from Settings.
- Completion (%) — A 0–100 slider. The filled portion of the bar shows progress; combine with the Today Marker to spot delays at a glance.
- Resources — Comma-separated names, optionally with a percentage allocation:
Alice, Bob:50%. Labels appear on the task bar. - Link — A URL that makes the task bar clickable in the final SVG (e.g. a Jira ticket or spec document).
- Note — Free-text annotation rendered as a PlantUML note below the task bar in the diagram.
Generate the Gantt Diagram
When your tasks are ready, click "Generate Gantt Diagram". GanttTool performs the following steps automatically:
- Validates that every task has a non-empty name.
- Checks the dependency graph for cycles using depth-first search.
- Compiles a PlantUML
@startganttcode block from your settings and tasks. - Sends the code to the Kroki rendering API (
/api/kroki) and retrieves a vector-quality SVG image.
The SVG diagram appears in the preview area within a few seconds. A spinning loader is shown during rendering; any syntax error or service-unavailability message is displayed clearly with an error description.
Viewing the PlantUML source
Click "Show PlantUML code" to toggle a panel displaying the raw PlantUML syntax that was sent to the renderer. This is useful for debugging or learning the underlying language — see our dedicated PlantUML Gantt Diagram Format guide for a deep dive into the syntax.
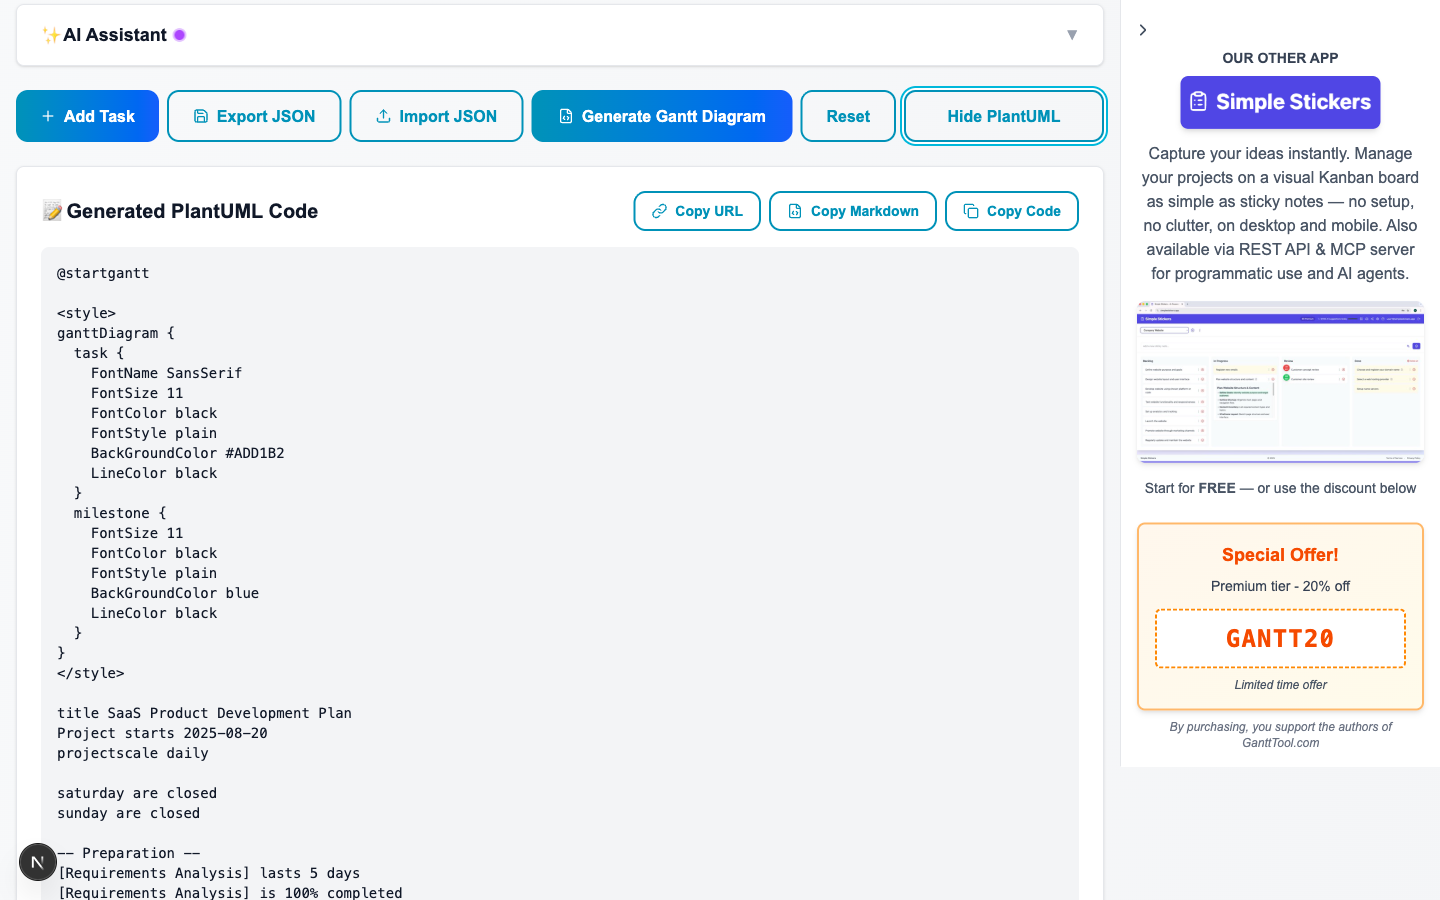
Speed up planning with AI: GanttTool includes a built-in AI assistant that can draft an entire Gantt project from a plain-English description in seconds — read how it works in the AI Gantt Chart Assistant guide.
Export and Share Your Diagram
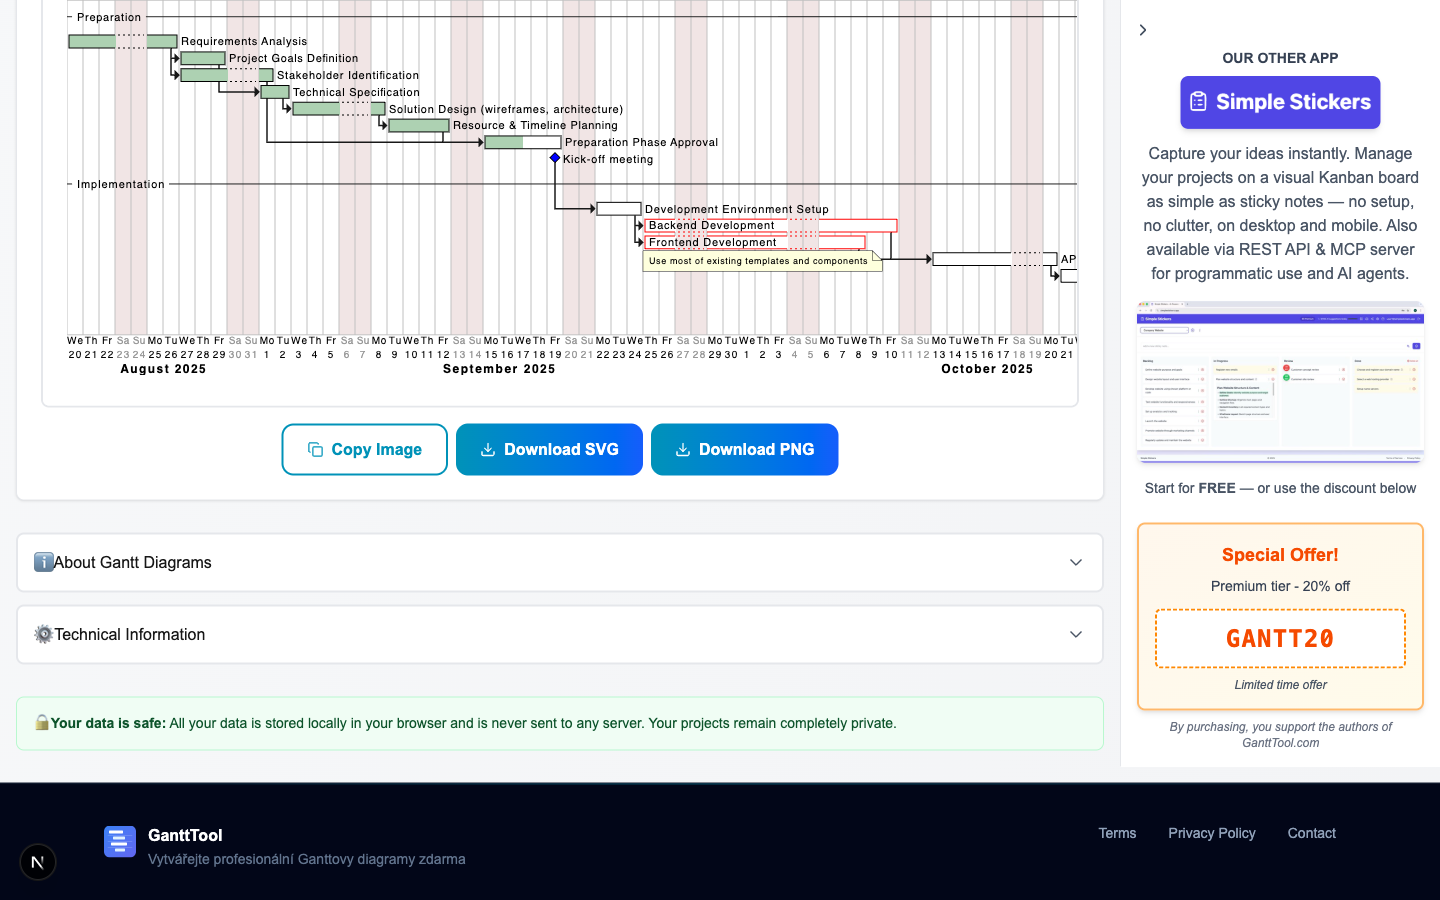
Once the diagram is generated, the export toolbar appears below the preview. You have four options:
| Button | What it produces |
|---|---|
| Download SVG | Saves the diagram as a scalable vector file — ideal for embedding in presentations, documents, or websites at any resolution. |
| Download PNG | Converts the SVG to a high-resolution raster image (2x pixel density) and downloads it as a .png file. |
| Copy Image | Converts the SVG to PNG and copies it directly to the clipboard — ready to paste into Slack, email, Notion, or any other tool. |
| Export JSON | Downloads the full project (settings + all tasks) as a .json file that can be imported later via the Import JSON button. |
In addition to manual export, your project is continuously auto-saved to browser LocalStorage under the key gantt_diagram_data. The next time you open the app in the same browser, your last project loads automatically. Use JSON export for long-term backups or to share the project with teammates.
Summary: Your Gantt Chart Workflow at a Glance
Here is the complete workflow in one place:
- Step 1 — Open gantttool.com/en/app. No account needed.
- Step 2 — Click "Load Demo" to explore a full sample project, or start fresh.
- Step 3 — Configure Settings: project name, start date, time scale, zoom, closed days, today marker, language, and style.
- Step 4 — Add tasks (Task / Milestone / Separator), set start types, durations, dependencies, colors, completion, resources, links, and notes.
- Step 5 — Click "Generate Gantt Diagram" to render the SVG via the Kroki API.
- Step 6 — Export as SVG, PNG, copy to clipboard, or save JSON — and rely on auto-save for ongoing work.
From a blank editor to a shareable professional diagram takes under ten minutes for most projects. The free Gantt chart maker handles the PlantUML syntax for you so you can focus on planning, not formatting.
Ready to build your Gantt chart?
Open GanttTool now — free, no account required. Start from the demo or describe your project to the AI assistant.
Open GanttTool — it's freeRelated Articles
What Is a Gantt Chart?
History, structure, waterfall planning, anatomy — phases, tasks, milestones, dependencies.
AI Gantt Chart Assistant
How GanttTool's AI understands plain-English instructions and auto-generates tasks.
PlantUML Gantt Diagram Format
Deep dive into PlantUML syntax — tasks, milestones, colors, and advanced styling.